PBI Best Practices - Preferred DAX Formulas
Last Period Indicators (Last week, Last year)
There are several ways of computing the last periods, including PREVIOUS YEAR... those functions are compatible with Indexima.
However, in terms of performance, Indexima recommends using another way:
CALCULATE(
	VAR MaxYear=MAX(TimeTable[year]))
	VAR SelectedYear = SELECTEDVALUE(TimeTable[year],MaxYear)
	RETURN
		CALCULATE( myfacttable[myIndicator], TimeTable[year]= SelectedYear -1
)
source: Dynamic Last Week Indicator
YearToDate, MonthToDate, QuarterToDate
PowerBI provides easy to use Formulas to compute those indicators
_viaTOTALxTD_YTDSales = TOTALYTD(SUM(fact_sales[salesamount]),'calendar'[date])
_viaTOTALxTD_QTDSales = TOTALQTD(SUM(fact_sales[salesamount]),'calendar'[date])
_viaTOTALxTD_MTDSales = TOTALMTD(SUM(fact_sales[salesamount]),'calendar'[date])
However, using Indexima, we recommend using the following formulas instead. (This will require the creation of a date Dimension hosted in indexima instead of the one in PowerBI)
'Current Year' Indicators
YearToDate
_CY_YTDSales = CALCULATE (
    sum(fact_sales[salesamount]),
    FILTER (
        ALL ( 'calendar'),
        'calendar'[calendar_year] = MAX ( 'calendar'[calendar_year]  )
            && 'calendar'[date]<= MAX ( 'calendar'[date] )
    )
)
QuarterToDate
_CY_QTDSales = CALCULATE (
    sum(fact_sales[salesamount]),
    FILTER (
        ALL ( 'calendar'),
        'calendar'[calendar_yearquarter] = MAX ( 'calendar'[calendar_yearquarter]  )
            && 'calendar'[date]<= MAX ( 'calendar'[date] )
    )
)
MonthToDate
_CY_MTDSales = CALCULATE (
    sum(fact_sales[salesamount]),
    FILTER (
        ALL ( 'calendar'),
        'calendar'[calendar_yearmonth] = MAX ( 'calendar'[calendar_yearmonth]  )
            && 'calendar'[date]<= MAX ( 'calendar'[date] )
    )
)
WeekToDate
_CY_WTDSales = CALCULATE (
    sum(fact_sales[salesamount]),
    FILTER (
        ALL ( 'calendar'),
        'calendar'[calendar_yearweek] = MAX ( 'calendar'[calendar_yearweek]  )
            && 'calendar'[date]<= MAX ( 'calendar'[date] )
    )
)
'Last Year' Indicators
LY YearToDate
_LY_YTDSales = CALCULATE (
    sum(fact_sales[salesamount]),
    FILTER (
        ALL ( 'calendar'),
        'calendar'[calendar_year] = MAX ( 'calendar'[calendar_year]  )-1
            && 'calendar'[date]<= MAX ( 'calendar'[same_daylastyear] )
    )
)
LY QuarterToDate
_BestPractIndexima_QTDSales = CALCULATE (
    sum(fact_sales[salesamount]),
    FILTER (
        ALL ( 'calendar'),
        'calendar'[calendar_yearquarter] = MAX ( 'calendar'[calendar_yearquarter]  )-100
            && 'calendar'[date]<= MAX ( 'calendar'[same_daylastyear] )
    )
)
LY MonthToDate
_BestPractIndexima_MTDSales = CALCULATE (
    sum(fact_sales[salesamount]),
    FILTER (
        ALL ( 'calendar'),
        'calendar'[calendar_yearmonth] = MAX ( 'calendar'[calendar_yearmonth]  )-100
            && 'calendar'[date]<= MAX ( 'calendar'[same_daylastyear] )
    )
)
'Previous Week' Indicators
WeekToDate
_CY_WTDSales = CALCULATE (
    sum(fact_sales[salesamount]),
    FILTER (
        ALL ( 'calendar'),
        'calendar'[calendar_yearweek] = MAX ( 'calendar'[Calendar_YearPreviousWeek]  )
            && 'calendar'[date]<= MAX ( 'calendar'[SameDayPreviousWeek] )
    )
)
'Last Year' Indicators when choosing Y-1 or Y-2
Additional steps to perform in PowerBI
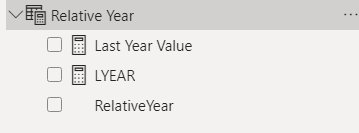
- Creation of an Import table
- named "Relative Year"
- with the Fomula: Relative Year = DATATABLE("RelativeYear",STRING,{{" Y-2 "},{" Y-1 "}})
- with 2 Measures
- Last Year Value = SELECTEDVALUE('Relative Year'[RelativeYear]," Y-1 ")
- LYEAR = if([Last Year Value] = " Y-1 ",1,2)
This will result as below

- Additional Column in Calendar Table1 (Date Dimension Table materialized in Indexima)
- SameDayLY = if( 'Relative Year'[Last Year Value]="-1",'calendar'[same_daylastyear],'calendar'[same_daylast2year])
(1): and not in the Relative Year Table
The 'Last Year' indicator is modified by using the column SameDayLY and the measure LYEAR
LY with Year as Variable QuarterToDate
_LY_RelYear_QTDSales = CALCULATE (
    sum(fact_sales[salesamount]),
    FILTER (
        ALL ( 'calendar'),
        'calendar'[calendar_yearquarter] = MAX ( 'calendar'[calendar_yearquarter]  )-'Relative Year'[LYEAR]*100
            && 'calendar'[date]<= MAX ( 'calendar'[SameDayLY] )
    )
)