Query History
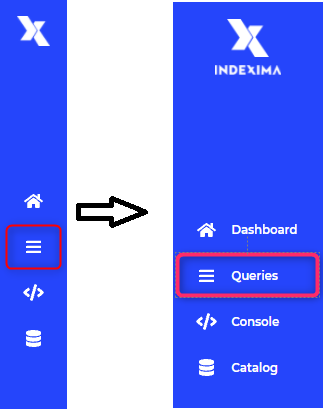
Access Query History
Screen overview
The query listing screen is divided into:
- Filter Zone.
- SQL query information.
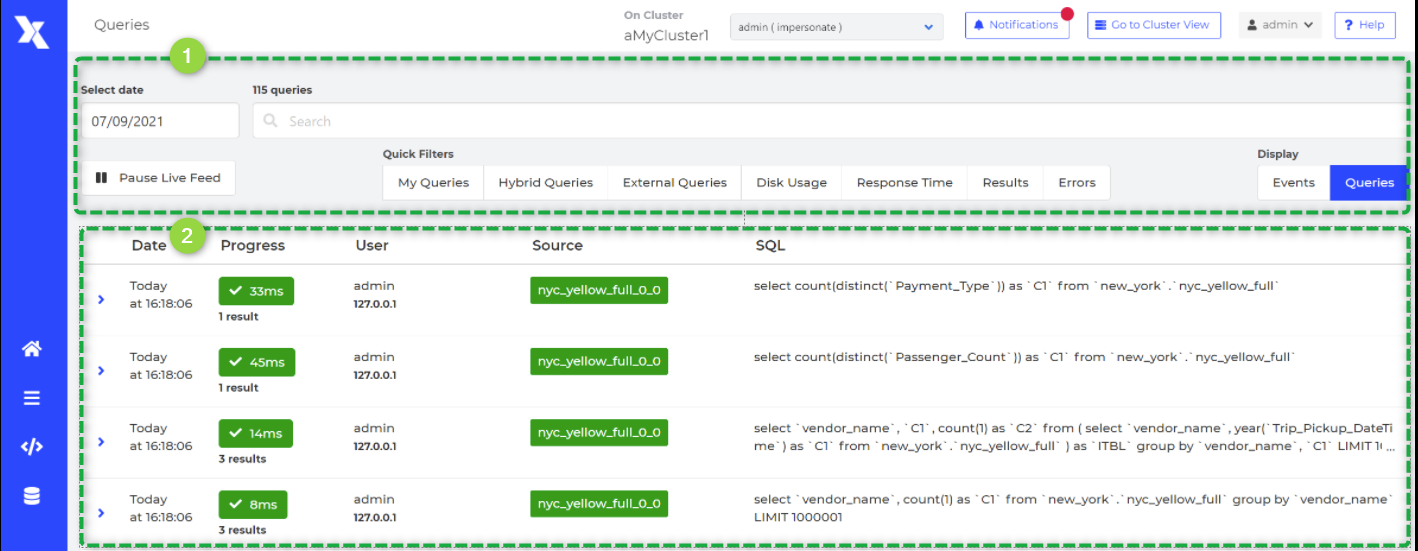
SQL query list with main overview information

| Field Name | Description |
|---|---|
| (Execution) Date | Timestamp of the execution of the Query, in your local timezone |
| Progress | This column displays the status and the total execution time of the query. Execution status:
Please note that on mouse over the progress, a tooltip provides some more insight:
|
| User | Username & IP address of the user that executes the SQL command |
| Source |
|
| SQL | SQL statement and number of results that this query generates |
SQL query detailed information
When you click on SELECT statements, the user can access more information about the SQL query.
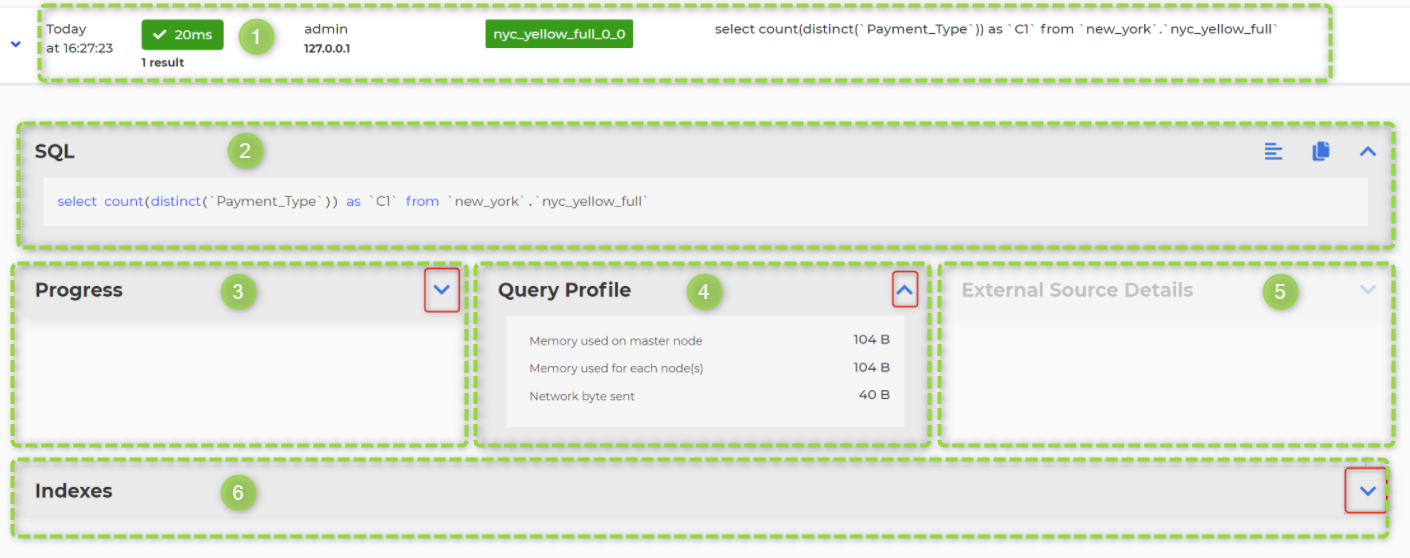
- SQL Query main overview information
- SQL Statement
- Progress
- Query Profile
- External Source Details
- (Used) Indexes
2. SQL Statement sub-panel

3. Progress sub-panel
The progress sub-panel displays the information regarding the progress of the query:
- the number of results for a select, or number of inserted lines for a load
- the number of tasks executed / to execute, for queries triggering sub-tasks
- the progress indicator for queries when it is still in progress
4. Query Profile sub-panel
The query profile displays the Query identifier. This identifier is also available in queries.csv log file, to identify a query.
Commun Metrics
There are three common metrics:
- memory used by the master node
- memory used by all nodes (incl. master node)
- network byte sent
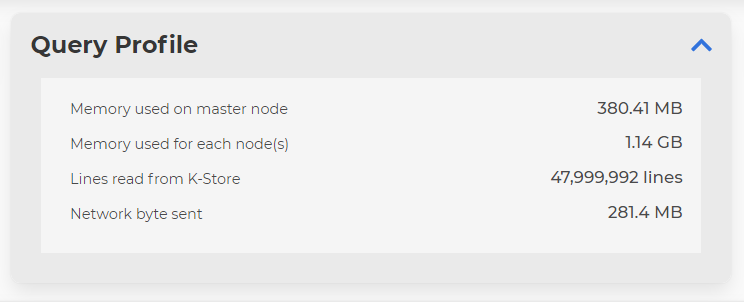
Metric "Lines read from K-store"
When the engine needs to get detailed rows to answer the query, the engine provides information about the number of lines that have been scanned.
Metric "Spill To Disk"
When a query spills on a disk, Query Profile shows you how much memory Indexima has allocated to local storage to perform the query.
More information on Spill-to-Disk is available here.
5. External source Details sub-panel
When a query is delegated to an external source (using an external table), the engine displays information about the external source & query.
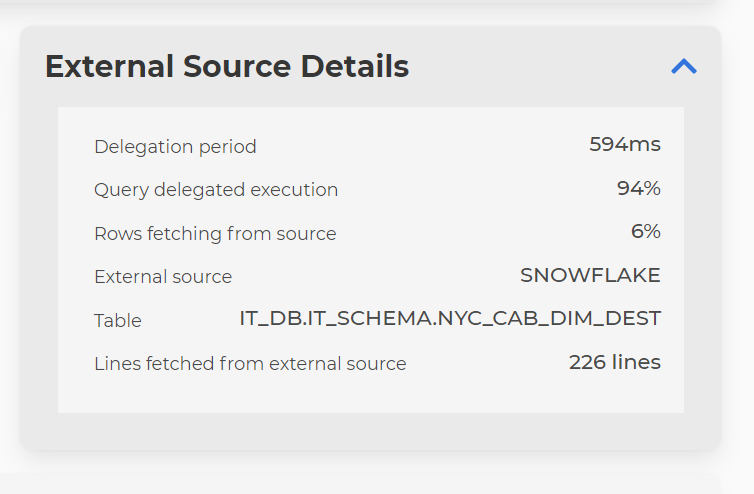
More information on External tables is available here.
| Name | Description |
|---|---|
| Delegation period | Duration to execute the query on the external data source |
| Query delegated execution | Percentage of delegation period to send the query and wait for execution |
| Rows fetching from source | Percentage of delegation period to retrieve results |
| External source | Name of the external data source |
| Table | Target table in the data source |
| Lines fetched from external source | Number of results fetched from the data source |
6. (Used) Indexes
The Indexes' sub-panel displays the detail of indexes used to execute the current query.
Indexes used by the current queries are displayed in green whereas the unused indexes are displayed in grey.
Filter queries
To facilitate research, queries can be filtered.
- You can combine multiple filters.
- You can go through the "quick filters" or type in the search bar directly.

The Select date field allows to select a date in the past, or to limit the time interval to analyze.
Please note that the day and the time interval are considered with the local timezone of your browser (whereas the timestamp in queries.csv log files are in UTC).
Please note that the query listing won't retrieve more than 10000 queries. In case the selected date / timeInterval contains more than 10k queries, you will see a notification that the results are partial, and you will need to reduce your time interval.
Search bar
By default, the search is only performed through the SQL statement.
When a user needs to filter queries attributes, he can use both quick (modifiable) filters and other custom filters.
Available filters
| Filter | Operator | Available filter values | Description | Quick filter | Applied filter when using a quick filter |
|---|---|---|---|---|---|
| user | : (means =) | Any string | Name of the user executing the query | My Queries | user:admin |
| hybridQueries | : (means =) | true/false | Queries requesting unindexed data on disk | Hybrid Queries | hybridQueries:true |
| external | : (means =) | true/false | Queries delegated to an external database | External Queries | external:true |
| responseTime | :<, :> | integer + ms / s / min | Response time of the query | Response Time | responseTime:>5000ms |
| resultsNb | :<, :> | integer | Number of results | Results | resultsNb:>5000 |
| inError | : (means =) | true/false | Query in error | Errors | inError:true |
| diskUsage | : (means =) | true/false | Queries using disk access for any reason (Spill to disk, Disk backed results or BigIndex) | Disk Usage | diskUsage:true |
| spillToDisk | : (means =) | true/false | Queries using disk for temporary storage during execution | ||
| diskBackedResult | : (means =) | true/false | Queries using disk for output buffering | ||
| bigIndex | : (means =) | true/false | Queries using disk to store index on disk | ||
| freezing | : (means =) | true/false | Queries currently frozen due to Big requests feature | ||
| freezeDuration | :<, :> | integer + ms / s / min | Queries frozen more than this duration Eg: freezeDuration:>10s | ||
memoryUsed | :<, :> | integer + B / KB / MB / GB | Queries using more than a certain amount of memory to execute Eg: memoryUsed:>2GB or memoryUsed:>500MB | ||
| indexUsed | : (means =) | Any string | Queries using specific indexes Eg: indexUsed:tb1_v0,tb1_v1 (no space between index names) | ||
| cachedQueries | : (means =) | true/false | Queries using cache | ||
| ip:192.168.1.1 | : (means =) | One IP address | Queries launched by a specific IP address |
Display Events
You can also display the "events" by clicking on the button on the right.
Note that you cannot filter events. 
More information: see Events History.
